
Air quality chart;
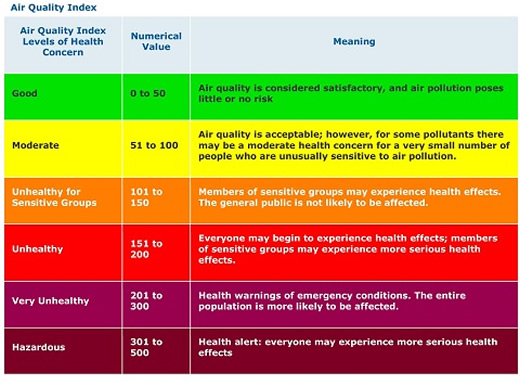
This is what the U.S. looks like on a bad air quality day (it’s usually greener),

This is what China looks like on a GOOD air quality day (it’s usually much worse);

This was Seoul, South Korea today (check the chart again, notice how it only goes up to 500);

